Many things point to a high if not a top

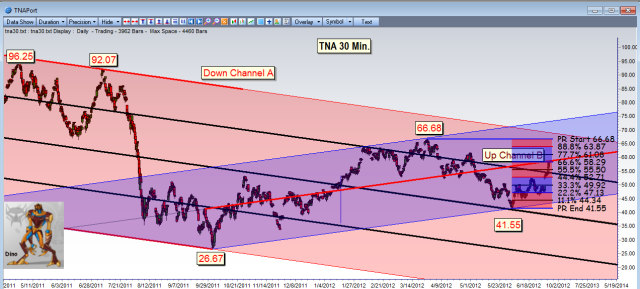
This is my TNA 30 minute chart.  Looking at it

1. TNA stopped at the mid point of the Up Channel B

2. The inverted H&S from 41.55 to 49.92 = 8.37 should end at 58.29 and yesterday’s high was 57.99.

3. My belief is that the 1st rally 41.55 to 49.92 tells u something and if I assume that to be 50% (confirmed by H&S ) of the total expected move then its fair that the total move should end at 58.29.

4.  We have been up for 3 days and  4 days is in a row is very low odds.

5.  We are done with July 4th probly 2nd most important  date in Gann’s books next only to Thanksgiving on Nov. 24th.   Market will show a change of direction at this point my opinion is it will go down.

6.  I have other time cycles pointing to down.

Here is an XIV chart that also confirms my thinking.
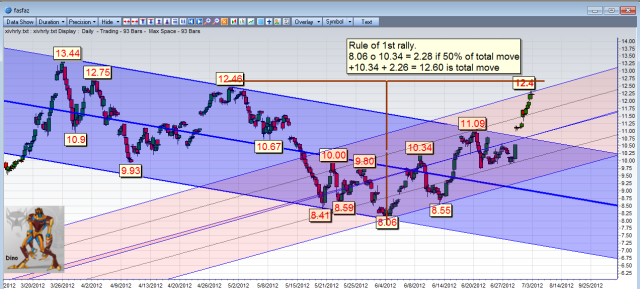
 I have marked a T.that also points to end of a cycle.

I know there is loud noise about a ECB rate cut.  But have you looked at EURO it is not looking good.  It rallied from 1.240 to 1.270. Now it is hovering around 1.254.  If all the problems are fixed and rate cut is in the air should this be at 1.30 and up.  There is some problem here.

Above all we should be getting some very important stats very soon.  My calling this a market high if not a a second wave top  is a bet that the numbers are going be bad.

Anyways you get what I mean.  If the market opens plus I plan to short it.

Thanks for reading my blog please visit our new chat room BLYVe there is a quite number of people  and its interesting.  Thanks again

Posted in etf | Tagged , , | Leave a comment

Spotlight on Dow

The decline continues even though today was an up day.  The range was only 14 points.  It was an inside day.  The close was 9 points from the bottom and 4 points from the top.  Any time SPX closes above the 50% point of the range it is bullish for the next day.  It was first day of plus closing.  Thats also a positive. Multi day rallies and declines have to start somewhere.  This is a 30 min. SPX chart.  Today’s low of 1309 was 55.55% decline  to the rally from 1266 to 1363.  But today’s rally was lukewarm.  Now what has happened twice  in this decline so far is we get a big decline (30 and 21 points) followed by a tepid inside day rally.  My sense is we should get a whack tomorrow.  Say 35 points or so on SPX.   I am driven by my belief that markets will put in a good bottom the day after July 4th.

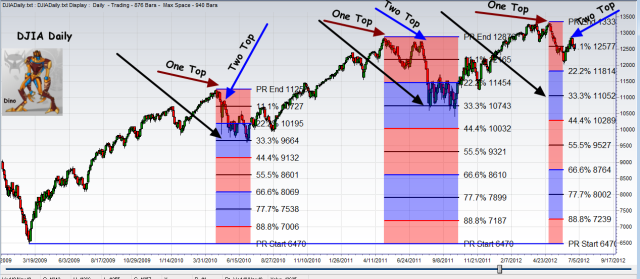
Next is Dow daily chart. 

Some recurring points

(1) Dow corrects 33.33% or 1/3rd approx for the move that starts at 6470.  First was from 6470 to 11258 and corrected to 9664.  Second was from 6470 to 12870 and declined to 10743.

(2) There are 2 tops in  both declines.  Look closely and you will also see 2  bottoms.

(3) The last leg of the decline near continuous where we get 5/6 days negative close.

(4) There is a small period of flatness before we take off.

I am overall bearish and this just adds to it.  I believe we are going to get hit hard and will see the Dow bottom around 11052.   Now to expect that to happen before July 4th would be wishful thinking.  But I do think we will take out the old low 12035.  Its more probable that we stage a fake rally after the 4th.  Thats my current thinking.

Thanks for reading my blog

Posted in etf | Tagged | Leave a comment

Decline unfolds…..

The decline has just started and lets see how far it takes us.  Perhaps SPX  can take out 1291 ; and then 1266. or on the other side take out 1363 I am not in favor of that.

(1) This reactionary rally we had for the 250 point drop was well within the norms.  1363 to 1324 = 39 point 1/3 of that is 13 points and add that to 1324 and the high we got was 1337.

(2) Now Friday was an inside day meaning the previous action which was down would continue.

(3)  Thursday was the 180th day from 1074  low on Oct 4th last year and we had a huge drop on Thursday.  This establishes 1074 as a major pivot point and gives good odds that we will see 1074 – (1422 – 1074)  = 726.  Thats Dire forecasting  math for us.

(4)  Yep! there is end of quarter window dressing coming up.  Best time for stocks to rally or floor to sell.  But looking at data shows June endings are usually flat. SPX has traded within a 25 point range last 11 years in the last week of June.  Most rallies came on last day of month.

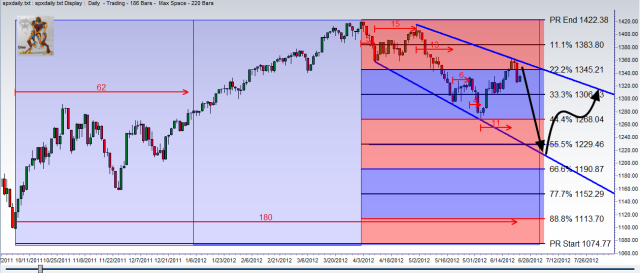
(5)  I know every one is counting the decline from 1422 to 1266 as a five step 1.  I have some problems with that.  The number of daily candles for 1,2,3,4 and 5 are  5; 15; 13; 6; and 4.  and the problems is the number candles for wave 4 and 5. They look very very low.

I am thinking that drop 1415 to 1266 was a 3 and it took 23 candles.  We just finished 4 at 1363 and are in final 5 and the cadles would count like 5 ; 15 ; 23 ; 11; and 5 would end at 1229 probly a day after July 4th,   I can see people jumping Oh! no 4 can’t go into 1 by 5 points in 1350 so this whole count is wrong. Hey this is  just me thinking.

Here is  spx daily chart supporting

Thanks for reading my blog

Posted in etf | Tagged | Leave a comment

Did Counter rally end today?

Times are changing So to stay locked in to one analysis becomes a self defeating proposition after a while. Almost all of us knew this counter rally from 1266 would end some day and fresh more severe decline would ensue soon after. As markets kept jumping up like a locust many including myself started looking a logical highest point where this would end. IMO it did today. Here is why
1. Fed is out of its best bullets the one that gives largest number of kills — Interest rates
2. They have done the direct QE1 and QE2  Those bullets are also gone
3. They have been monkeying around with length of contracts lowest return for the buck.
What Benny said multiple times was we have other methods to stimulate. Translation FEDs best methods are all done and haven’t produced what it wanted Fed will now use some useless methods and prey.  Bottom line the markets did not react positively to the news from FED.   This counter rally was all in anticipation of easing and they failed and the rally ended.
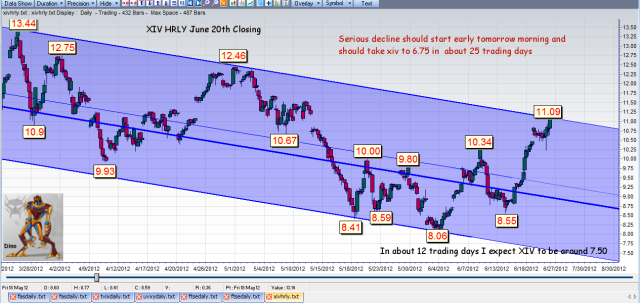
This is a chart of XIV and what its telling me starting tomorrow we should see a fast and furious drop to 7.25 in about 12 days and then a rally followed by another drop to end this cycle at 6.75 and that would be in 25 trading days from tomorrow.  Exciting times on the downside that I have been waiting for a while I think are finally here. I plan to short as soon as the indicator perks up.

Thanks for reading my blog.

Posted in Uncategorized | Tagged | Leave a comment

QE-3 or modified easing decision tomorrow?

Why 1398 looks like it to me.

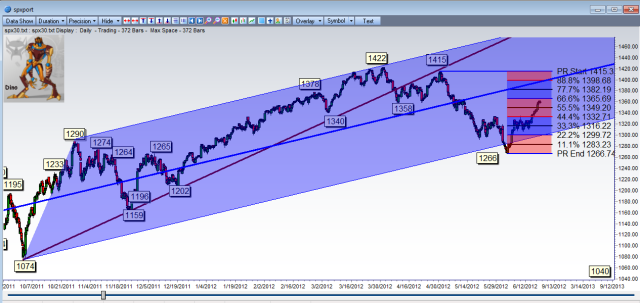
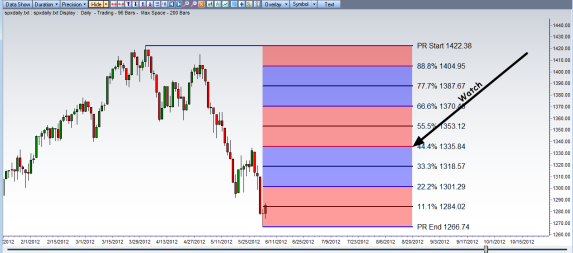
(1)  It is the 88.8% retracement point for the decline from 1415 to 1266.  (2) It is the mid point of the blue channel (3) The inverted H&S is between 1334 and 1266 which is 68 points and double that and add it to 1266 and we get 1402.  Close to 1398. (4)  Wave a 1335.xx – 1266 = 68  and b is 1335 – 1306 = 29 which is approx 44% of the advance wave a.  Next at 1398 wave c becomes 1398-1306 = 92 points roughly 138% of wave a 68  (5)  From my last 2 posts if the first move was 55% then end comes to 1392.

Here is another point if fed monkeys around says something ambiguous we may see this tomorrow.  I would wait for the signal though say about a 25 point decline from any high before I short.

Thanks for reading my blog.

Posted in Uncategorized | Tagged | Leave a comment

Outside in Fibonacci

Right of the top I think the bottom in SPX is around 1012 in 10 more weeks.

We all know what Fibonacci numbers are in reference to stock market.  At the risk of being called nerd let me repeat very commonly used  ones  0.854 ; 0.764 ; 0.618 ; 0.5 ; 0.382; 0.236 ;0.146.  Technically 0.5 is more of a Gann number than Fib. number.  I only look at 0.618 and 0.382 in Fibonacci sequence.

Many use these numbers as percentages to calculate retracements  or counter bounce backs.  As a continuation of the post I wrote  couple of days ago   I am trying  to use this to play it forward.  I will think of the first decline from the top as 38.2% of the total decline that is going to come and try to project where the end point would be.

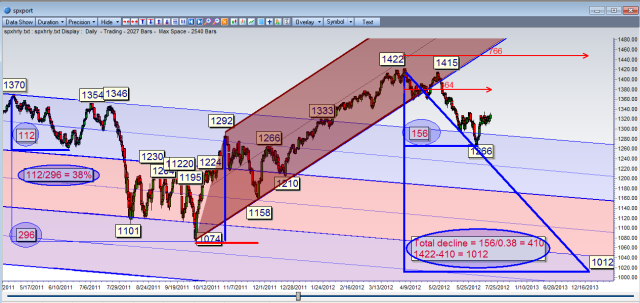
I used 1370.  The first decline to 1258 was 112 points. If I anchor that as 38.2% the total decline the projected total decline was going to be 112/0.382 That comes to 294 and taking that off 1370 gave me a projected low of 1076.  Well what do you know The actual decline was 296 points to 1074.  Bet you are wide eyed by now.  Graph is below.

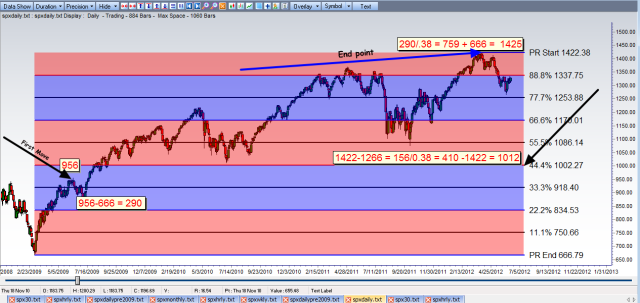
Lets do 1422.  The first decline was to 1266 that was 156 points. Projected total decline =156/.382 = 410 points rounded and taking that off from 1422 I get 1012.   Why 10 more weeks? Its just the same time as 2011 but starting from April 2nd.  This puts this around last week of August.  That is at the 180th week from the 666 low and its an important Gann date.

Here is “Big” example.

Here is ultimate example

Thanks for reading my blog and try it on a daily chart and  one more thing pl. keep it a secret.

Posted in Uncategorized | Tagged | Leave a comment

Fork

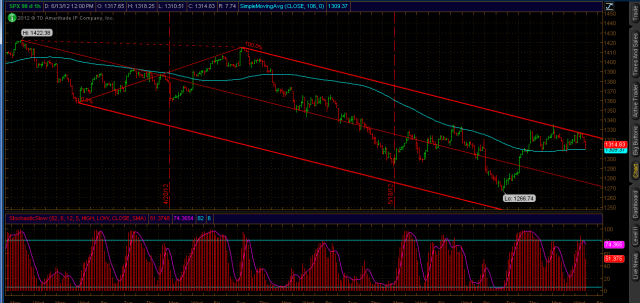
I made this chart a while ago and haven’t seen it.  Its telling we have more to go on the downside.  This is a much easier chart to count the wave with.   We could be in wave 5 of 1.  Also we are coming off a triple top. The projected low is 1968 very close to old low 1266.  Generally 5s IMO do not exceed the limits of 3 by too much unless we have an extended 5 and that is not that common.

Posted in Uncategorized | Tagged | Leave a comment

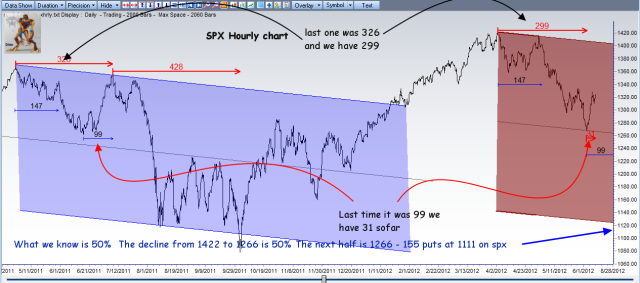
6-10-12 After spain pain

Exactly what was expected from the “leaders” . Spain was bailed out and markets are going crazy. Now here is a chart I have been looking at a lot today this tells me we have few more days to go to a top of some sort.

Secondly I am introducing a new way of looking at the GANN concept of 50%.  When markets rally after a initial decline they are rallying from what would eventually become a 50% point.  This is not exact for Mr. Gann is not here to guide us.  Take  look at the blue channel (Red arrow tip spot) that was the first low and it became approx 50% point of the total decline.  Try it on a minute chart for a day your eye will pop.

IMO the trend is down but unless one has deep pockets its better to wait for declines to start again. I would say 25 points from any high should tip the odds in favor of bears.

Thanks for reading my blog

Posted in Uncategorized | Tagged | Leave a comment

Chart deposits

IMO it is not correct to count this as 1 2 3 4 and 5;  1 there is no question 1422 t0 1357 and took six candles adding both start and end candles.

2.  1357 to 1415 with 16 candles.   but 3 looks incomplete and what happened to 4 only 7 candles and 5 if only 5 candles.

MY Conclusion is 3 is not complete.  Bear market rallies are usually very big and end with lot of hot air.

Image

Posted in Uncategorized | Tagged , | Leave a comment

Where are we?

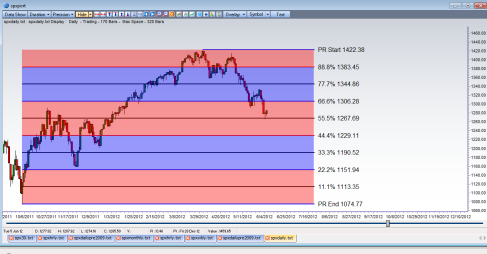
This is my SPX monthly chart.  The 1074 bottom once again happened at the  44.4%  line of the Dino’s Price Retracement  Level.  But that is based  on the range of decline from 1576 to 666.  The top 1370 is a a retracement to decline rom 1576 to  666 at 77.7% level which I believe is very valid.   But the 1074 is not high probability low.  The retracement levels to watch are 1050 as a 44.4%  and 980 the 55.5% for the rally from 666 to 1370. There is also a very chance we may hit 823 for a 77.7% drop based on how 77.7% has behaved on previous occasions  The last month’s candle is an inside month candle  which implies the trend which is down to  continue.

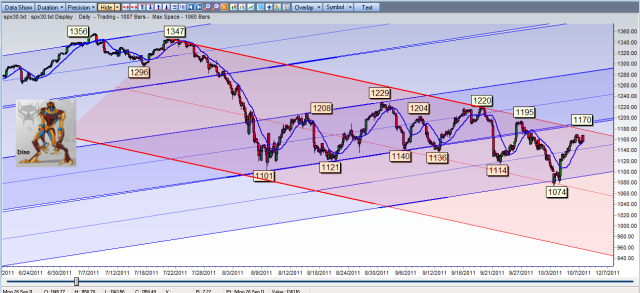
This is my 30 minute chart of SPX.  In 1987 when the crash occurred the mkts did a very similar thing up and down in a range for over a year before taking off to the upside. It never made a lower low always a higher low and higher high.  Here we have opposite situation lots of lower lows and  lower highs and very few higher highs.  LH and LL is not what a bullish market makes.The 1074 touched the bottom of the upward blue channel and we can now see why it rallied from there.  Now take a look at 110 that too touched a bottom blue and took off only to be turned down by the upper blue channel.   The red down channel took over control and knocked it down hard that blue let go of the support SPX had to step lower.  Now we have very similar situation.  I believe either we topped out again or we may get a small push to touch the top line (May be) and will revist the blue line follwed by a small rally to red or near before getting whacked to the bottom of the red channel.   In terms of numbers rally from near 1100 to 1140 then down to 1050.

So ..we have completed a a rally and decline has started and will catch steam shortly.   I expect the markets to bottom near the very end of the month (180 Calendar days  and 135 trading days from top 1370) before a useful rally.

Thanks for reading my blog

Posted in Uncategorized | Tagged , | 3 Comments